【JACS】吉林大学宋大千、马品一|灵敏度达2.75 aM!单发光体比例型ECL传感器,实现外泌体miRNA超灵敏检测
通讯作者: Pinyi Ma (马品一), Daqian Song (宋大千)
文章概要
引言
电致化学发光(ECL)因其背景干扰低、灵敏度高及激发过程可控等优势,在生物分析领域得到了广泛应用。然而,传统的单信号检测模式极易受到环境波动、电极界面状态及实验操作误差的影响,导致检测结果的可靠性受限。为了克服这一瓶颈,研究者们开发了比例型ECL传感器,但现有的比例系统多依赖于双发光体或复杂的双电位/双波长切换,这不仅增加了材料合成的复杂性,还可能因为不同发光体间的信号失步而降低准确性。针对这一挑战,吉林大学的马品一教授和宋大千教授团队提出了一种全新的思路,利用缺陷工程改造的氮化碳材料,构建了基于单发光体余辉发射的自校准比例检测平台,为临床复杂的生物样本分析提供了更加稳定精准的工具。
Scheme 1. Schematic Illustration of the Proposed Ratiometric ECL Biosensor
主要实验及结论
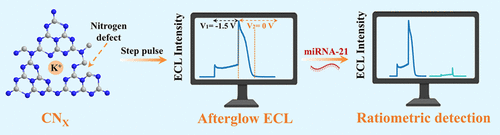
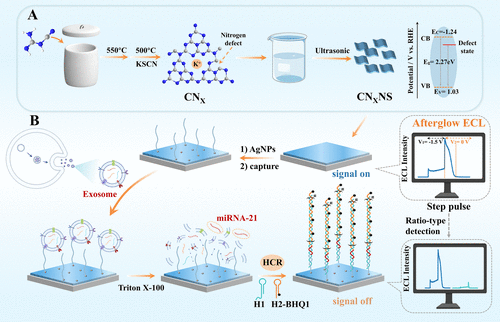
研究团队首先通过硫氰酸钾辅助的热处理方法制备了富含氮缺陷的石墨相氮化碳(CNx)。实验发现,这种材料具有独特的电子结构和电荷俘获能力。在脉冲电信号激发下,注入的电子能被暂时储存在缺陷能级中,当外部电压撤除后,这些被俘获的电荷会缓慢释放并与共反应剂自由基发生反应,从而产生长达12秒的余辉ECL信号。这种余辉发射在时间尺度上与常规的电激发信号实现了有效分离,具有极低的背景噪声。
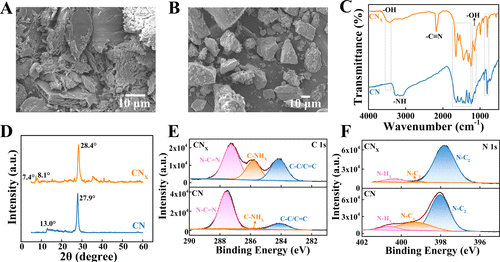
Figure 1. SEM images of (A) CN and (B) CNX at a scale of 10 μm. (C) FT-IR spectra. (D) XRD patterns. XPS spectra of (E) C 1s and (F) N 1s.
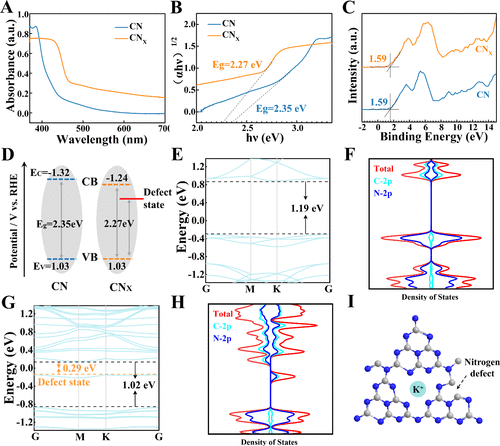
Figure 2. (A) UV–vis DRS spectra. (B) Tauc plot. (C) XPS VB spectra. (D) Schematic diagram showing the band structure alignments. Calculated band structures and corresponding PDOS of (E, F) CN and (G, H) CNX. (I) Schematic diagram demonstrating the molecular structure of CNX.
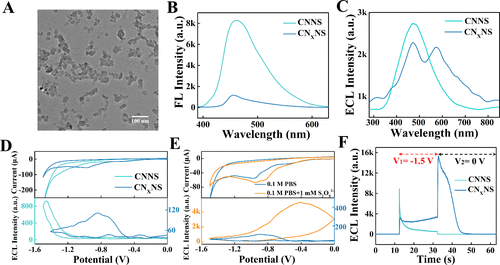
Figure 3. (A) TEM image of the CNXNS. (B) FL and (C) ECL spectra of CNNS and CNXNS. (D) CV and ECL responses of CNNS- and CNXNS-modified GCE in 0.1 M PBS. (E) CV and ECL responses of the CNXNS-modified GCE in 0.1 M PBS with or without 1 mM S2O82–. (F) Comparison of the afterglow ECL of CNNS and CNXNS.
基于这一物理特性,团队设计了一个针对外泌体miRNA-21的传感平台。通过在电极表面修饰CNx纳米片和金纳米颗粒,并利用杂交链式反应(HCR) 引入猝灭剂BHQ-1。实验结果表明,由于常规ECL和余辉ECL信号源自相同的发射中心,它们对目标分子的响应具有内在的相关性。随着miRNA-21浓度的增加,BHQ-1通过能量共振转移同时猝灭两种信号,但由于余辉信号对环境变化更为敏感,余辉强度与常规ECL强度的比值表现出极佳的线性关系。该传感器的线性范围覆盖了10 aM至100 pM,检测限(LOD)低至2.75 aM,其灵敏度远超同类单信号传感器。此外,在乳腺癌患者血清样本检测中,该平台成功区分了健康人群与癌症患者,充分证明了其在临床早期诊断中的实际应用潜力。
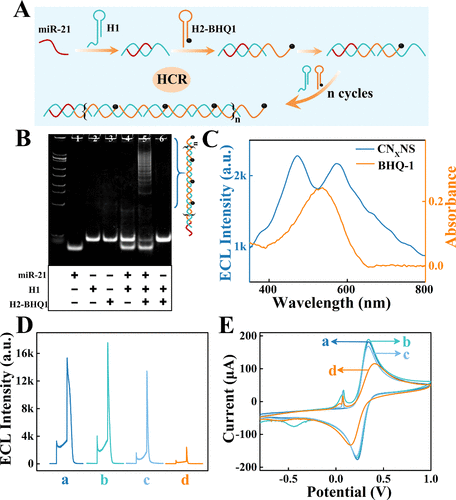
Figure 4. (A) Schematic diagram of the HCR process. (B) PAGE analysis of the HCR process. (C) The overlap is between the ECL spectrum of CNXNS and the UV–vis absorption spectrum of BHQ-1. (D) ECL responses and (E) CV curves (in [Fe (CN)6]3–/4– solution) recorded during the stepwise assembly of the ECL biosensor: (a) CNXNS/GCE; (b) AgNPs/CNXNS/GCE; (c) capture/AgNPs/CNXNS/GCE; and (d) miRNA-21, H1, H2-BHQ1/capture/AgNPs/CNXNS/GCE.
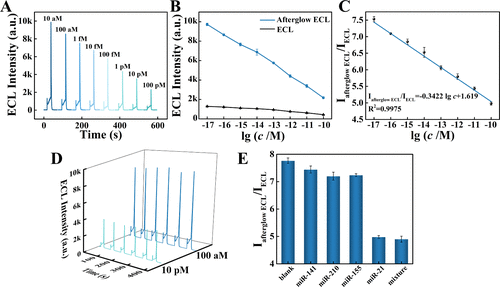
Figure 5. (A) ECL and afterglow ECL intensities of the biosensor during detection of miRNA-21 at different concentrations (10 aM, 100 aM, 1 fM, 10 fM, 100 fM, 1 pM, 10 pM, and 100 pM). (B) Changes in intensity with increasing miRNA-21 concentration. (C) Calibration curve showing the relationship between _I_afterglow ECL/_I_ECL ratio and the logarithm of miRNA-21 concentration (n = 3). (D) Stability of the biosensor. When the miRNA-21 concentration was 100 aM, the RSDs of the ECL and afterglow ECL signals were 3.38 and 1.55%, respectively. When the miRNA-21 concentration was 10 pM, the RSDs of the ECL and afterglow ECL signals were 2.00 and 2.24%, respectively. (E) Selectivity of the ECL biosensor toward miRNA-21.
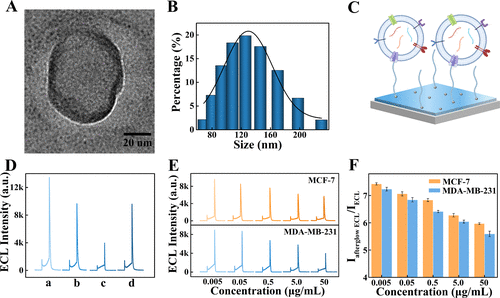
Figure 6. (A) TEM image of an exosome. (B) DLS analysis. (C) Schematic illustration of exosome capture on the electrode surface. (D) ECL responses of (a) capture/AgNPs/CNXNS/GCE, (b) exosome/capture/AgNPs/CNXNS/GCE, (c) Triton X-100, H1, H2-BHQ1/exosome/capture/AgNPs/CNXNS/GCE, and (d) H1, H2-BHQ1/exosome/capture/AgNPs/CNXNS/GCE. (E) ECL signals and (F) _I_afterglow ECL/_I_ECL ratios of the ECL biosensor obtained during the analysis of miRNA-21 in exosomes at different concentrations from MCF-7 and MDA-MB-231 cells.
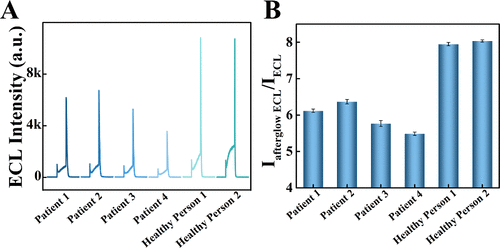
- Figure 7. Analysis of miRNA-21 levels in human serum samples. (A) ECL and afterglow ECL responses. (B) Iafterglow ECL/IECL ratios.
总结及展望
这项工作不仅成功开发了一种超灵敏的miRNA检测方法,更重要的是确立了单组分比例型ECL的新框架。通过巧妙地利用材料的结构缺陷实现时间分辨率上的信号输出,该策略有效避免了传统比例系统中多组分干扰和信号不相干的问题。这种基于时间维度解耦的检测思路具有普适性,未来可以扩展到更多基于半导体材料的生物传感研究中。随着对余辉动力学研究的深入,这种自参考、高稳定性的分析模式有望在单细胞分析、即时检测(POCT)以及更复杂的临床液体活检领域发挥关键作用。